Calculate Parasitic Loss from Superchargers
Table of Contents
- What Is Parasitic Loss in a Supercharger?
- How Superchargers Consume Engine Power
- Roots vs Centrifugal Supercharger Parasitic Loss
- The Formula for Calculating Parasitic Loss
- Dynamometer Testing and Real-World Measurements
- Reading a Supercharger Efficiency Map
- Minimizing Parasitic Loss in Your Build
- Conclusion
Last Updated: August 20, 2026
What Is Parasitic Loss in a Supercharger?
Parasitic loss in a supercharger is the mechanical drag and friction that the supercharger itself creates as it operates. Your engine must work harder to drive the supercharger's internal components, directly reducing the net horsepower gain you feel at the wheels.
The energy cost comes from friction between internal rotors or gears, drag from spinning the impeller through dense air, heat generation during compression, and mechanical resistance of the belt or drive system. According to mechanical engineering research on forced induction systems, supercharger efficiency typically peaks at slightly more than 80 percent at about half the engine's rated speed, then decreases considerably at higher speeds.
A supercharger might absorb anywhere from 10% to over 20% of your engine's total power output, depending on its type and how hard it's working. If your engine makes 400 horsepower, a supercharger could consume 40 to 80 horsepower just to operate. Understanding this trade-off is critical for determining whether forced induction is worth the investment for your vehicle and driving goals.
Pro Tip
Supercharger efficiency changes dramatically across your engine's RPM range. A blower efficient at 5,000 RPM might be a power hog at 7,000 RPM. [Choosing the right supercharger type](/blogs/news/how-to-choose-a-supercharger-kit-a-2026-guide) and pulley ratio for your intended use matters more than most builders realize.
How Superchargers Consume Engine Power
A supercharger consumes power through two distinct mechanisms: mechanical drag and thermal inefficiency.
Mechanical drag is straightforward physics. The supercharger's internals must spin at high speed, creating friction between moving parts, bearing resistance, and air compression drag. The belt connecting the supercharger to your crankshaft adds its own friction losses. All this energy comes directly from your engine's combustion output.
Thermal inefficiency occurs when a supercharger compresses incoming air. Some heat energy is wasted rather than converted into useful boost pressure. A centrifugal supercharger operating at peak efficiency might achieve 70-80% adiabatic efficiency, meaning 20-30% of compression energy becomes wasted heat.
According to FE Power LLC's dynamometer study on centrifugal supercharger power consumption, at 6,000 RPM with varying boost levels (7, 13, and 17 psi), horsepower loss scaled with boost pressure, more boost meant more parasitic drag.
The relationship between boost pressure and power consumption isn't linear. One pound per square inch of boost translates to approximately 13 rear-wheel horsepower, but parasitic loss to generate that boost increases exponentially. Doubling boost pressure doesn't double power consumption; it costs significantly more.
Key Takeaway
Parasitic loss scales non-linearly with boost pressure. Doubling your boost can triple power consumption. Conservative boost levels often deliver better real-world efficiency than aggressive ones.
Roots vs Centrifugal Supercharger Parasitic Loss
The type of supercharger you choose dramatically affects power consumption. Each design trades efficiency differently.
Roots-type superchargers use two rotating lobes that trap and push air into the intake manifold. This simplicity comes at a cost: they typically consume 15-30% of the power they generate, according to Patsnap Eureka's analysis of supercharging technologies. They produce boost pressure directly proportional to engine RPM, meaning they're always working hard, even at cruise speeds when boost isn't needed. Roots superchargers deliver immediate low-end torque but generate significant heat and require larger pulleys to manage parasitic loss. Their adiabatic efficiency can be as low as 50% or below at higher pressures.
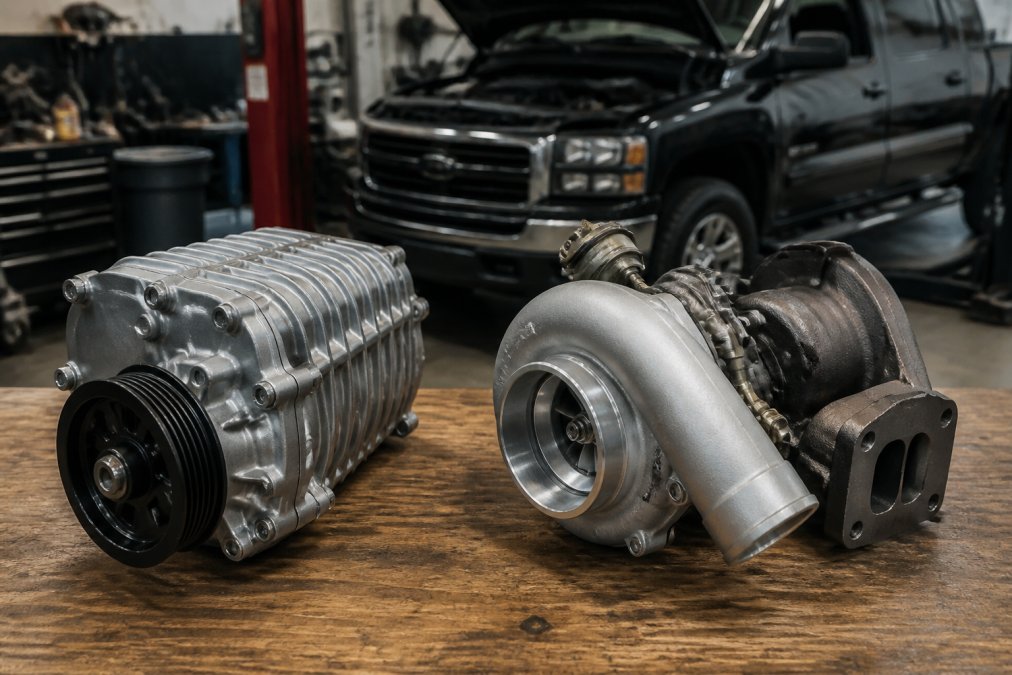
Centrifugal superchargers use an impeller spinning at very high speed (often 50,000+ RPM) to accelerate air outward, creating boost pressure. They're more efficient than Roots designs because they only produce meaningful boost at higher engine RPMs. At cruise speeds and low throttle, a centrifugal blower spins slowly and consumes minimal power. Centrifugal systems often show better fuel economy losses than Roots designs, typically 0.5-1 MPG at cruise versus 1-2 MPG for Roots installations. A high-quality centrifugal design might achieve 65-75% adiabatic efficiency, translating to lower parasitic loss per pound of boost generated.
Twin-screw superchargers occupy the middle ground. They use interlocking helical screws to compress air more gradually than Roots designs, achieving 65-75% adiabatic efficiency while delivering boost across a wider RPM range than centrifugals. Parasitic loss for twin-screw designs typically falls between Roots and centrifugal: around 12-18% depending on boost level and pulley ratio.
For daily drivers and off-road vehicles, the choice matters. A Roots blower on a truck that hunts gears on the highway costs 3-4 MPG in fuel economy. A centrifugal or twin-screw system on the same truck might cost only 1-2 MPG.
The Formula for Calculating Parasitic Loss
Calculating parasitic loss requires understanding the relationship between boost pressure, supercharger speed, and mechanical efficiency. You can predict real-world parasitic loss with reasonable accuracy using basic measurements and the SAE J1723 Supercharger Testing Standard.
The fundamental relationship is:
Parasitic Loss (HP) = Boost Pressure (psi) × Engine Displacement (cubic inches) × 1.3 / 8.5
For example, a 5.0-liter (305 cubic inch) engine running 7 psi of boost would experience approximately:
(7 × 305 × 1.3) / 8.5 = 38.6 horsepower parasitic loss
This is a starting point. Real-world parasitic loss varies based on supercharger type, pulley ratio, belt efficiency, and mechanical design.
A more precise calculation requires three inputs: supercharger displacement or flow rating (CFM), boost pressure (psi), and supercharger efficiency (percentage from manufacturer data).
Parasitic Loss = (Boost Pressure × CFM / Efficiency) / 63,025
Example: A centrifugal supercharger rated at 500 CFM with 71% efficiency running 8 psi of boost would consume:
(8 × 500 / 0.71) / 63,025 = 71 horsepower of parasitic loss
The critical variable is efficiency. A poorly designed supercharger at 55% efficiency consumes significantly more power than a high-quality unit at 75% efficiency, even at the same boost pressure. Always request efficiency ratings from your supercharger manufacturer before purchasing.
Watch Out
Many builders skip efficiency calculations and later discover parasitic loss is higher than expected. Always request efficiency ratings from your supercharger manufacturer before committing to a purchase.
Dynamometer Testing and Real-World Measurements
The only way to measure actual parasitic loss is with a dynamometer, a precision instrument that measures the power required to spin your supercharger at various RPM and boost levels.
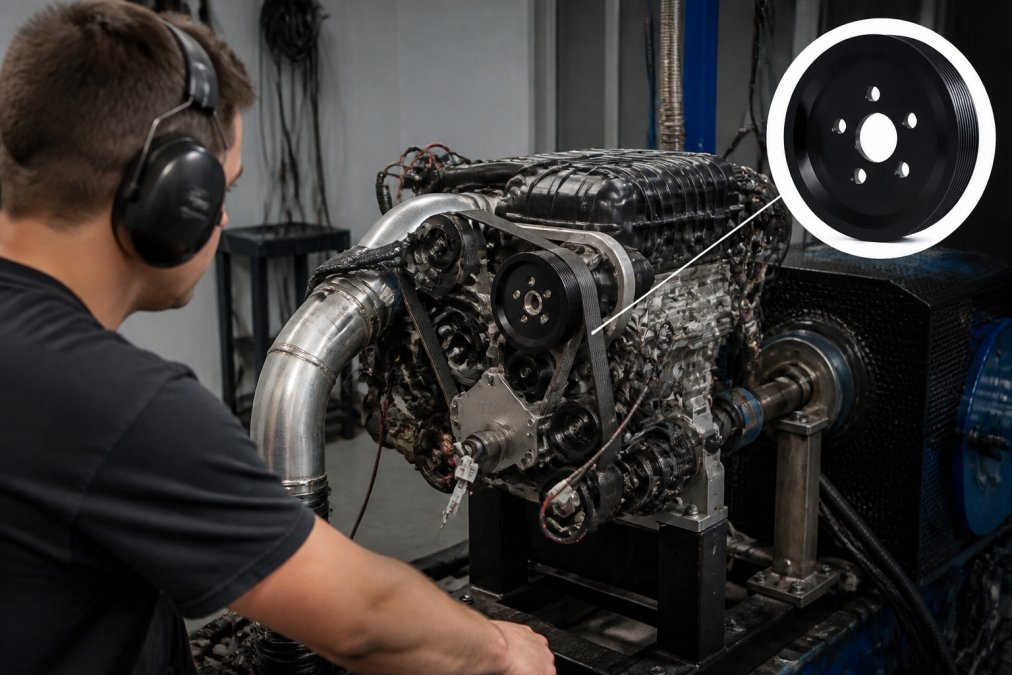
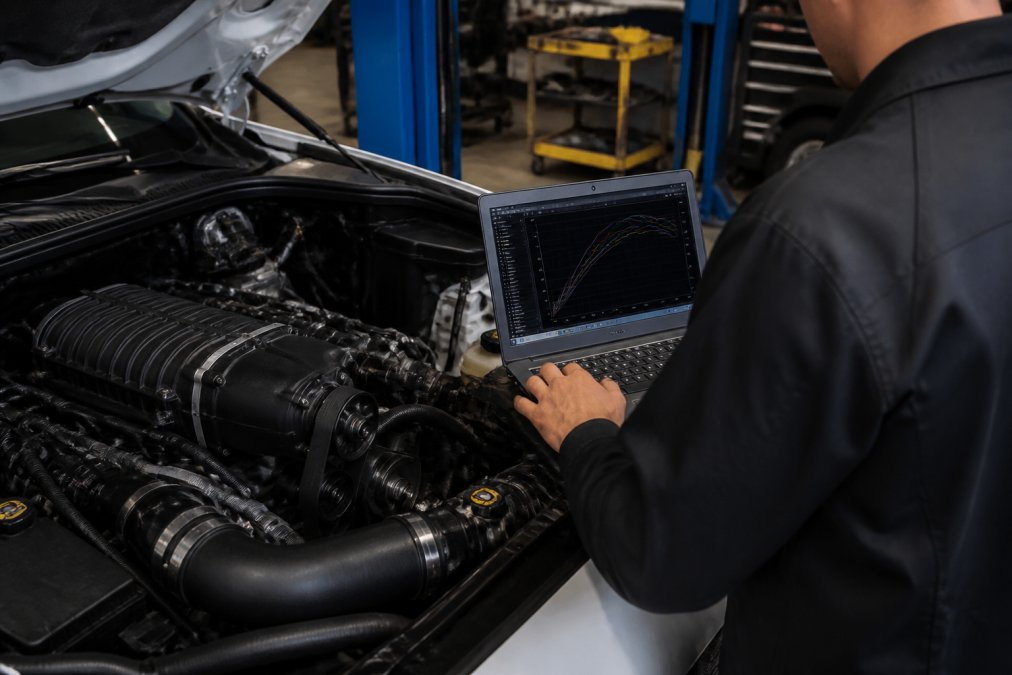
How dynamometer testing works: An engine is mounted on the dyno with a torque transducer installed on the crankshaft pulley. The transducer measures mechanical power required to turn the supercharger's drive belt at various engine speeds and boost levels. By comparing power output with the supercharger engaged versus a naturally aspirated baseline, technicians isolate exact parasitic loss.
According to Interface Force's analysis of supercharger testing methodology, a T22 Pulley torque transducer installed on the engine crankshaft successfully measures the power needed to turn the supercharger drive belt, enabling accurate parasitic loss data collection across the entire RPM range.
Real-world dyno results show variation between supercharger types. A centrifugal supercharger at 6,000 RPM with 7 psi of boost might consume 35 horsepower, while a Roots blower at the same RPM and boost level could consume 55 horsepower. At 15 psi, the centrifugal might consume 65 horsepower while the Roots design consumes 110 horsepower.
The TorqStorm case study illustrates this: their centrifugal supercharger, spinning at a maximum of 80,000 RPM, consumes only 47 crankshaft horsepower at peak load. If that blower generates 200 horsepower of additional airflow, the net gain is 153 horsepower, an 81% efficiency ratio.
Dyno testing also reveals efficiency curves. Most designs show peak efficiency at mid-range RPM (around 5,000-6,000) and declining efficiency at both lower and higher speeds. For serious builds, dyno testing validates parasitic loss calculations and confirms your supercharger choice delivers the net power gain you're expecting. Many performance shops offer dyno testing for $150-$300 per session.
Reading a Supercharger Efficiency Map
Supercharger manufacturers provide efficiency maps showing how efficiency changes across boost pressure and RPM ranges. Learning to read these maps lets you predict parasitic loss for your specific driving conditions.
A typical efficiency map has boost pressure on the horizontal axis and engine RPM on the vertical axis. Curves show efficiency percentages at different combinations. The goal is identifying where your supercharger operates most efficiently and understanding the efficiency penalty when venturing outside that zone.
For example, a centrifugal supercharger might show 72% efficiency at 7 psi and 6,000 RPM, but only 58% efficiency at 15 psi and 7,500 RPM. This tells you that running conservative boost at moderate RPM maximizes efficiency, while aggressive boost at high RPM significantly increases parasitic loss.
Key features to look for:
- Peak efficiency zone: Usually marked as a highlighted region where the supercharger performs best and parasitic loss is minimized.
- Efficiency contours: Lines connecting points of equal efficiency. Steep contours mean efficiency changes dramatically with small changes in boost or RPM.
- Falloff zones: Areas where efficiency drops sharply, conditions to avoid if minimizing parasitic loss matters.
Understanding where your vehicle's typical operating point falls on that map helps predict whether parasitic loss will be 15% or 25% of your boost output.
Minimizing Parasitic Loss in Your Build
Reducing parasitic loss doesn't mean sacrificing performance. Smart design choices minimize mechanical drag while maintaining boost pressure and power gains.
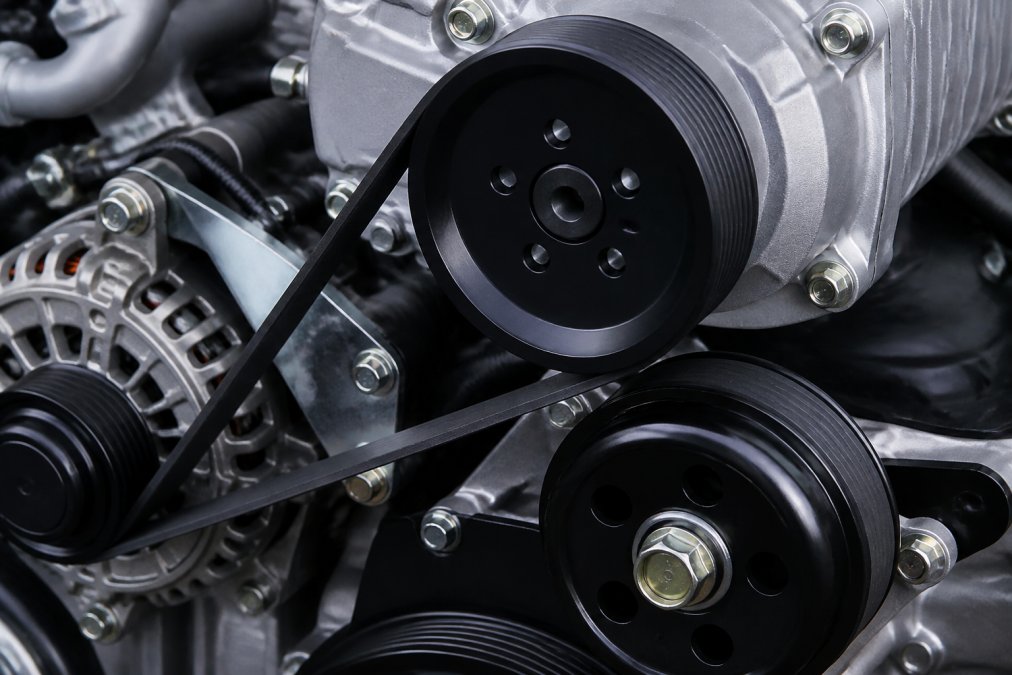
Pulley selection is the first lever. The drive pulley ratio determines how fast your supercharger spins relative to engine RPM. A smaller pulley increases supercharger speed and boost pressure but also increases parasitic loss. A larger pulley reduces parasitic loss but delivers less boost.
VT Superchargers offers multiple pulley options, including 61 mm and 63 mm pulleys for Mazda applications (both priced at $200.00), allowing you to dial in the exact boost level and parasitic loss trade-off for your vehicle. Choosing the larger pulley reduces supercharger RPM by roughly 10%, which can cut parasitic loss by 5-8% while slightly reducing peak boost pressure.

Belt efficiency matters more than most builders realize. A worn, glazed, or misaligned belt slips under load, reducing power transfer efficiency and increasing parasitic loss. A quality serpentine belt with proper tension can improve overall system efficiency by 2-3%.
Cooler inlet air reduces parasitic loss by lowering the density of incoming air. Installing an intercooler or cold-air intake can improve efficiency by 5-10%, particularly at high boost levels.
Mechanical efficiency of the supercharger itself is non-negotiable. A worn supercharger with loose bearings or damaged rotors consumes significantly more power than a new unit. If buying used, request dyno testing to confirm actual parasitic loss.
Conservative boost levels are the simplest way to minimize parasitic loss. Running 7 psi instead of 12 psi reduces parasitic loss by roughly 40-50%. VT Superchargers kits operate at 5-7 psi, a deliberate choice to balance performance gains against parasitic loss and mechanical stress on stock engine internals.
Best For
Daily drivers and off-road vehicles where reliability and fuel economy matter more than peak horsepower. Conservative boost levels (5-7 psi) minimize parasitic loss while delivering meaningful torque improvements and responsiveness gains.
Parasitic loss is real, measurable, and avoidable through smart design choices. The difference between a poorly matched supercharger and an optimized one can be 50+ horsepower of parasitic loss.
VT Superchargers designs kits engineered specifically to minimize parasitic loss through conservative boost levels, efficient pulley ratios, and proven mechanical designs. Register today to explore supercharger options for your specific vehicle and get real performance numbers backed by dyno testing and efficiency calculations.
| Supercharger Type | Typical Parasitic Loss | Best For | Efficiency Range |
|---|---|---|---|
| Roots-type | 15-30% of output | Low-end torque, simplicity | 50-60% |
| Centrifugal | 10-18% of output | High-RPM power, efficiency | 65-75% |
| Twin-screw | 12-20% of output | Balanced performance | 65-75% |
Frequently Asked Questions
How much parasitic loss does a supercharger have?
Parasitic loss from a supercharger typically ranges from 10% to 25% of the engine's total power output, depending on type and operating conditions. Mechanical superchargers consume 15-30% of the power they generate. At peak efficiency (around half the engine's rated RPM), charging efficiency reaches slightly above 80%, but drops considerably at higher speeds. A centrifugal supercharger at 6000 RPM with 7-17 psi of boost shows measurable horsepower loss compared to a naturally aspirated baseline, while a TorqStorm blower consuming 47 crankshaft horsepower can still deliver a net gain of 153 horsepower when producing 200 horsepower of airflow.
What is the difference between parasitic loss in roots-style vs. centrifugal superchargers?
Roots-type superchargers have higher parasitic loss and generate more heat during compression, typically costing 1-2 MPG in fuel economy. Centrifugal superchargers are more efficient, with lower parasitic drag and minimal heat generation, often costing only 0.5-1 MPG at cruise speeds. Twin-screw designs fall between the two, delivering smoother power with less parasitic loss than roots designs. The efficiency difference becomes significant in daily driving: roots designs consume power proportional to engine RPM, while centrifugal designs concentrate their efficiency gains in the upper RPM range.
Do you lose horsepower with a supercharger?
You lose horsepower to parasitic drag, but the net gain is significantly higher. For example, one pound per square inch (psi) of boost generates approximately 13 rear-wheel horsepower. If a supercharger consumes 47 crankshaft horsepower but produces 200 horsepower of airflow, the engine sees a net gain of 153 horsepower. Studies show that brake thermal efficiency improves with supercharging, and brake specific fuel consumption decreases compared to naturally aspirated engines, meaning the power trade-off is worthwhile for performance gains.
How do you measure the power required to drive a supercharger?
Dynamometer testing with a torque transducer is the standard method. A T22 pulley torque transducer installed on the engine crankshaft measures the power needed to turn the supercharger drive belt at various RPM and boost levels. The SAE J1723 Supercharger Testing Standard provides a standardized methodology for efficiency rating, reference inlet air supply test conditions, and methods for correcting observed efficiency to standard conditions. This allows direct comparison of parasitic loss across different supercharger designs and operating points.
This article was written using GrandRanker
Related post


RECENT POSTS